
Monitor and manage server status, connections, sync, tool execution history, and game change history in real time from a web browser.
Overview
The dashboard is the web-based monitoring interface provided by the MCP server. It opens automatically in your browser when the MCP server starts, and lets you track everything the AI agent does in Roblox Studio in real time.
- Understand system state visually without digging through terminal logs
- Track what the AI changed in Studio via the change history
- View sync status, connection status, and tool execution statistics in one place
How to Access
The dashboard opens automatically in your browser when the MCP server starts. To open it manually:
http://localhost:3002Set
DASHBOARD_AUTO_OPEN=falseto disable automatic opening.
Available Features by Connection State
| State | Condition | Available Pages |
|---|---|---|
| Server disconnected | Server not running | Reconnection waiting screen only |
| Server connected | Server connected, plugin not connected | Connection, Tools, Settings |
| Studio connected | Both server and plugin connected | All pages |
Status Cards
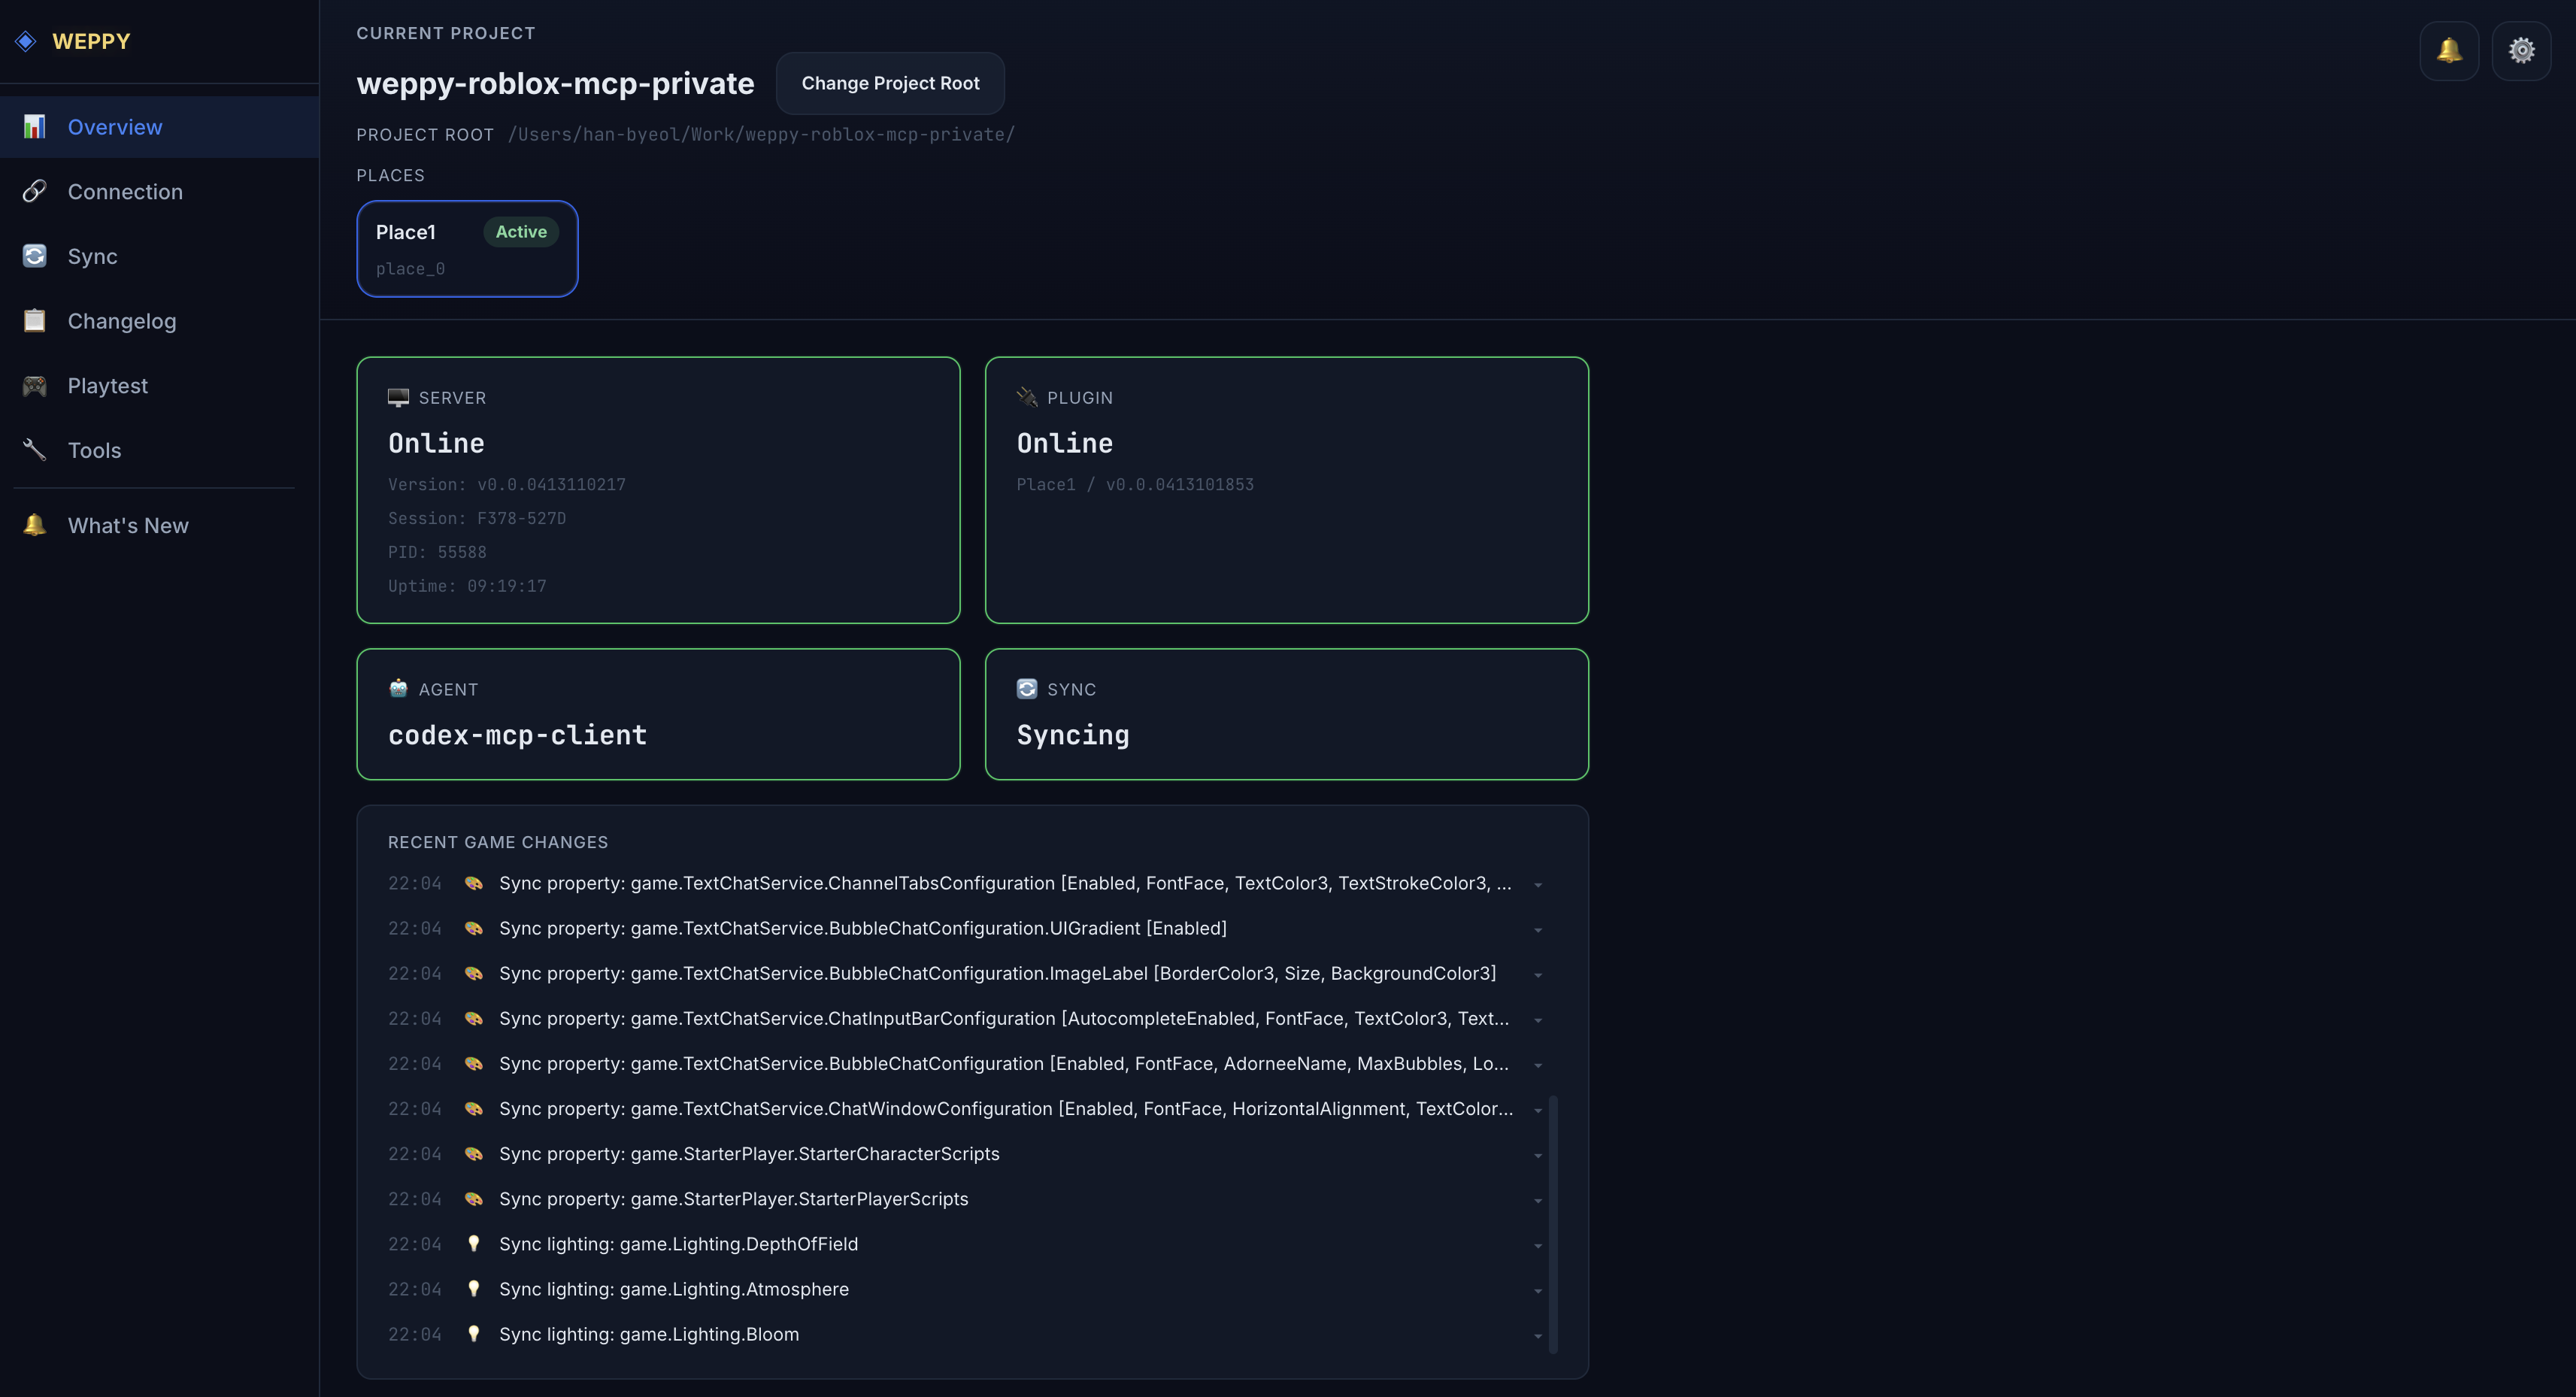
The Overview page is the dashboard’s home screen and shows the overall system state at a glance.
| Card | Information Shown |
|---|---|
| Server | Server connection state (Online/Offline) |
| Plugin | Plugin connection state and Place info |
| Agent | Currently connected AI agent name |
| Sync | Sync state (Idle/Syncing/Error) |
Recent Game Changes
Displays the most recent changes the AI made in Studio in real time (up to 20). Each entry is shown with a change category icon, and clicking it takes you to the Changelog detail view.
Category icons:
- Script — scripts created/modified
- Instance — instances created/deleted/moved
- Property — property changes
- Lighting — lighting/environment changes
- Terrain — terrain changes
- Asset — assets inserted
The dashboard uses SSE (Server-Sent Events) to update data in real time. It automatically reconnects 3 seconds after an SSE connection is lost.
Connection
Inspect the MCP server, attached AI agents, connected Studio Targets, and connection log in one place.
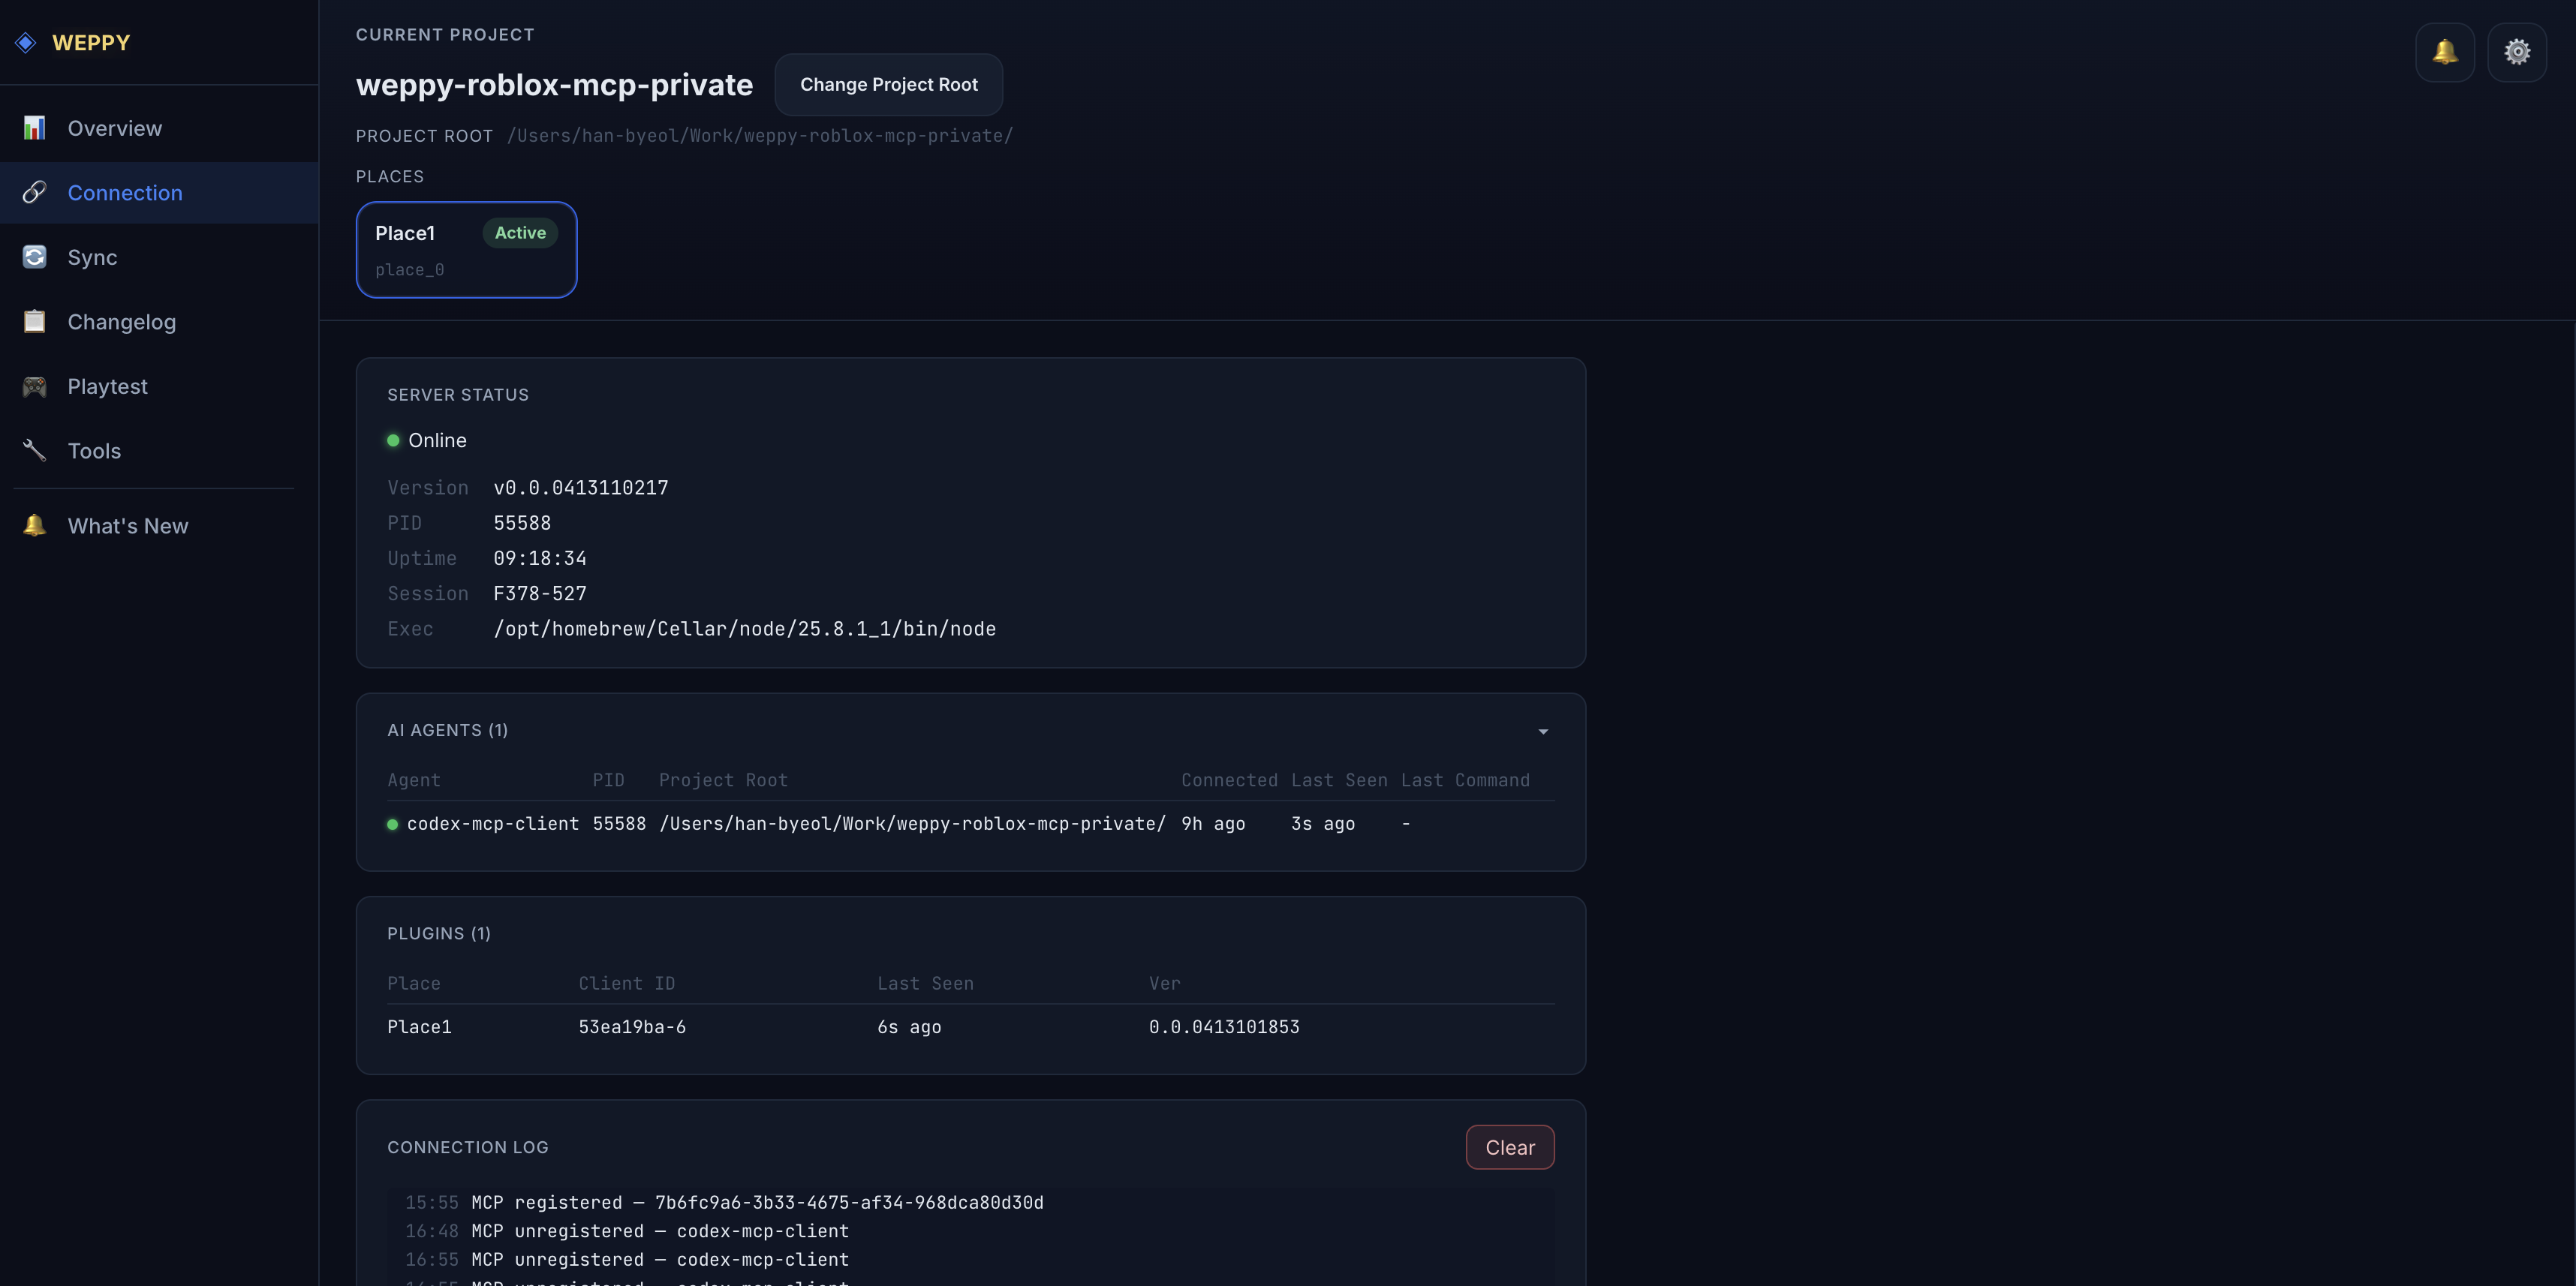
The Connection page is the fastest way to understand how the local MCP runtime is wired at the moment. It is available whenever the dashboard is in Server connected or Studio connected state.
Connection Topology
The topology map shows three conceptual columns: AI Agents → MCP Server → Studio Targets. It is display-first: connector lines show what is attached to the MCP server, but they do not change routing by themselves.
The MCP Server node shows server status plus the current routing summary for requests that do not name a Studio target.
Studio Targets
Studio Targets are the connected Roblox Studio windows that can receive MCP requests. Each target displays:
| Field | Meaning |
|---|---|
| Studio ID | Short selector such as studio-1 that you can copy into an agent prompt |
| Place / Place ID | The Roblox place currently associated with that Studio window |
| Connection ID | The full connection identifier for diagnostics |
| Last Used / Last Seen | When WEPPY routed work to the target and when it last heard from it |
| Routing | Whether the target is currently Priority or Pinned |
| In Flight | Whether a request is currently running on that target |
To aim an agent at a specific Studio window, copy the Studio ID and say something like use Studio ID studio-1.
Studio Routing
Studio routing only affects requests that do not name a Studio target.
- Automatic: Recent priority chooses the highest-priority active Studio target. Recent routed work takes priority over simple heartbeat activity.
- Manual: Pinned Studio sends selector-less requests to the pinned connected target.
- Explicit Studio ID, Connection ID, or Place ID in an agent request always wins over the dashboard routing mode.
Connection shows the current mode and a Manage routing link. Change the mode or pinned target from Controls → Studio Routing.
Multi-agent and Multi-Studio Workflows
Use this page when more than one agent or Studio window is active. You can keep Claude Code, Codex, Gemini, or another agent connected at the same time, and keep Lobby, Game, Shop, or Tutorial Places visible as separate Studio Targets.
Good prompts are explicit about the target:
Use Studio ID studio-1 for this change.Run this in the Lobby place, not the World place.Check studio-2 before changing shared scripts.In studio-1, add the event portal to Lobby. In studio-2, add the arrival point and guide UI to Game.
This is useful when one request needs to split work by Place, or when separate agent sessions each name their target Studio ID. One agent does not directly send work to another agent. Check which Studio ID belongs to which Place in Dashboard before prompting, so each agent modifies the intended Place.
For prompt patterns and a wrong-Place checklist, continue with the Multi-Place Work guide.
Diagnostics
The lower diagnostic tables keep the detailed Server Status, AI Agents, Studio Targets, and Connection Log data available for copying identifiers, checking working directories, and reviewing connect/disconnect events.
Controls
Set whether the AI can use Studio, and whether Script edits are automatically checked for syntax errors.
Luau Syntax Validation — Automatic Script Syntax Checking
When you let the AI edit Scripts, this setting automatically checks for Luau syntax errors right after the edit is saved. The check runs without starting Playtest, so it can immediately catch a missing end, a mismatched bracket, or two lines merging into broken syntax during an edit.
Available on both Basic and Pro. The default is Off. Turn it on or off from Controls → Luau Syntax Validation in Dashboard.
| Setting | After the AI edits a Script |
|---|---|
| Off | No automatic syntax check runs. Script edits complete at the usual speed |
| On | Checks the full code that was actually saved to Studio or the Sync file. If there’s a syntax error, the same response reports where and why |
This setting takes priority over the AI’s request. With On, the check still runs even if the AI tries to skip it — turning it off requires switching Dashboard to Off. Conversely, with Off, even if the AI asks for a syntax check along with a Script edit, the automatic check does not run, and the response tells the AI to switch Dashboard to On.
Finding a syntax error never undoes a change that was already saved. Instead, the AI can see which Script and which line to fix in the same response, so it can correct it before Playtest starts.
With On, the full saved Script is checked again, so larger Scripts can make the response a little slower. When the syntax is valid, the response stays as simple as usual; details are added only when there’s an error or the check couldn’t run.
The syntax check runs on your computer and never sends Script code to an external checking service. The file needed for the first check is downloaded from WEPPY’s GitHub Release, and later checks reuse the file already stored on your computer. If a network issue prevents the check file from being prepared, the Script edit still completes as normal, and the response reports that the syntax check could not run.
This setting only controls the automatic check that runs after the AI edits a Script. Even with Off, you can still ask the AI directly, “Check the Luau syntax of this Script.”
Sync
Monitor the current sync state, direction settings, and logs for Studio ↔ local file sync.
The Sync page visually shows the current state and configuration of Studio ↔ local file sync. It is only accessible when the dashboard is in Studio connected state.
Sync Status
| Status | Meaning |
|---|---|
| Idle | Sync is idle |
| Initializing | Initial sync in progress |
| Syncing | Incremental sync in progress |
| Error | Sync error occurred |
The status card also shows the sync path, number of synced instances, and the current Apply Mode (Auto/Manual).
Sync Directions
Shows per-type sync directions in a table:
| Column | Description |
|---|---|
| Type | Sync target type (Scripts, Values, Instances, Data, Services) |
| Direction | Sync direction (Local → Studio, Studio → Local) |
| Apply Mode | Apply mode (Auto/Manual) |
The Sync Log shows sync events in chronological order. Each log entry includes a change type tag (create, update, delete, etc.) and the target path.
Changelog
Records all changes the AI makes in Roblox Studio by session and provides a change summary, timeline, and Before & After comparison.
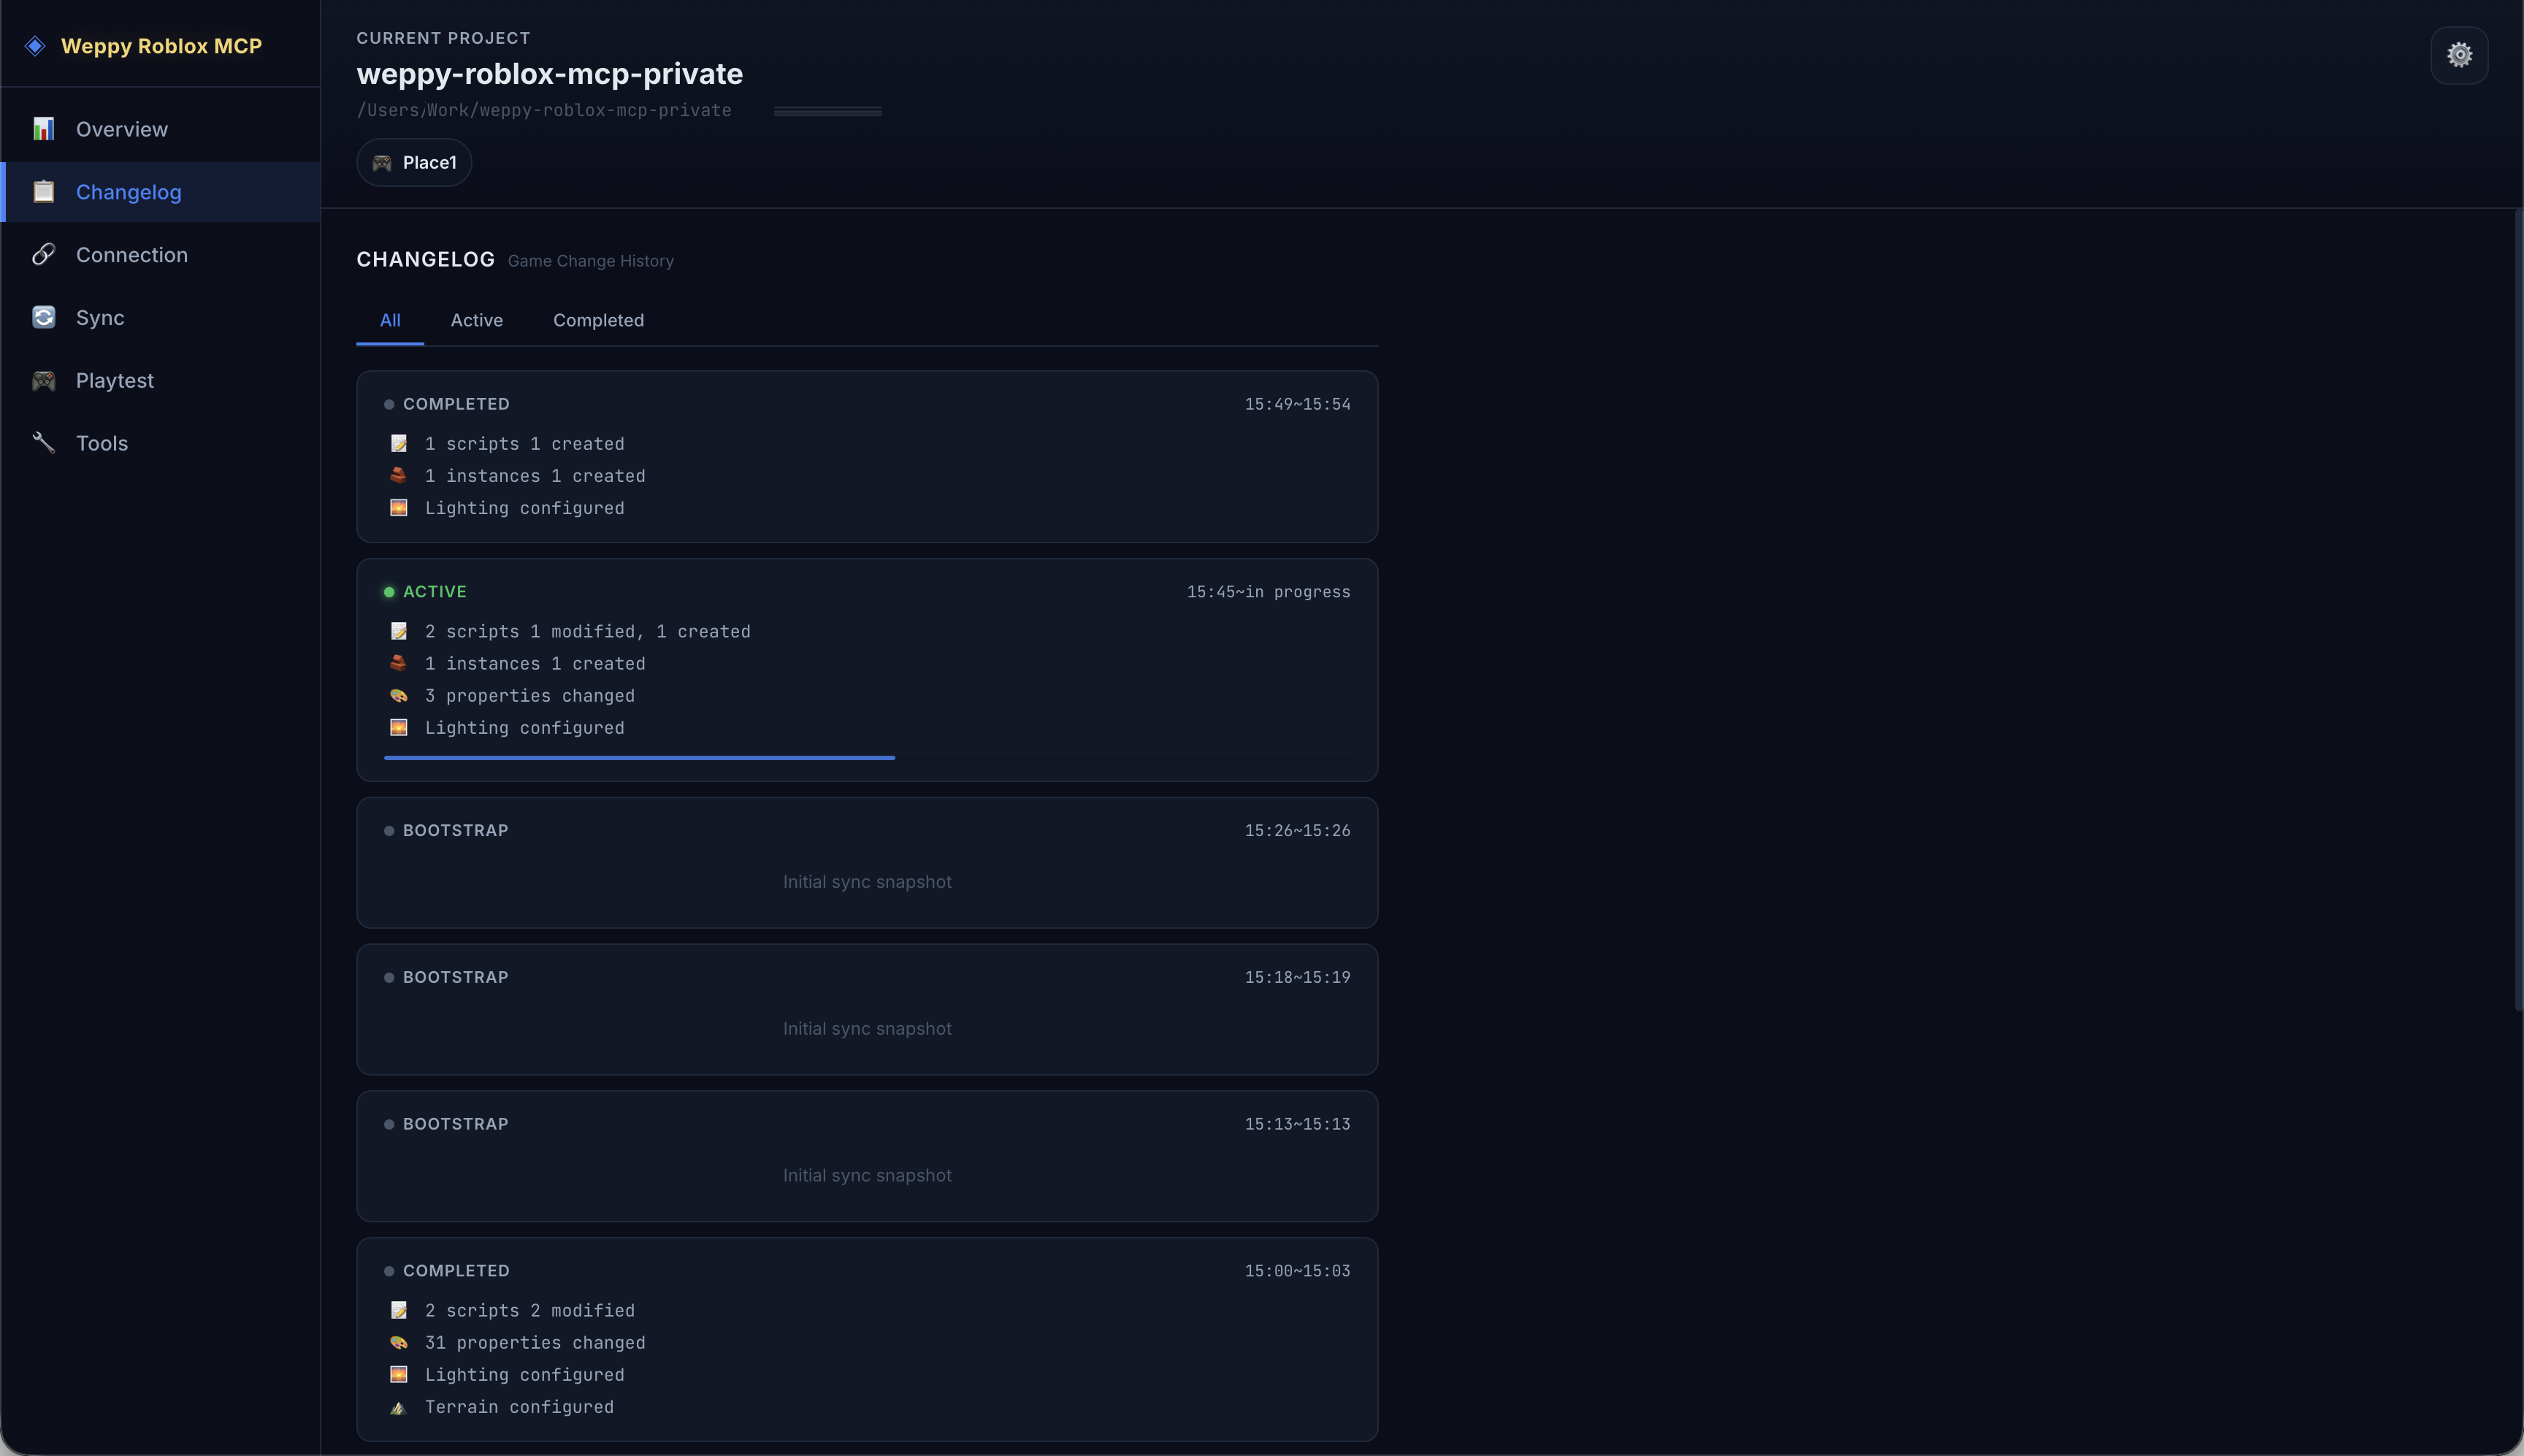
The Changelog tracks the game change history that AI agents perform in Studio. Changes are grouped by session so you can see at a glance what type of changes happened and how many in each session.
Session Card List
Each session card shows a status:
| Status | Meaning |
|---|---|
| Active | Currently ongoing session (updates in real time) |
| Completed | Finished session |
| Bootstrap | Initial sync session |
Each card shows a per-category count of changes for that session (Script, Instance, Property, Lighting, Terrain, Asset).
Use the top tabs to filter sessions: All, Active, Completed.
Session Detail View
Click a session card to enter the detail view.
Change Summary: Visualizes the session’s changes as 6 category cards (Scripts, Instances, Properties, Lighting, Terrain, Assets).
Change Timeline: Lists all changes in the session in chronological order. Use the Category dropdown to filter by a specific category; click an entry to expand the Before & After comparison view.
Before & After
| Confidence | Meaning | Example |
|---|---|---|
| exact | Before and after values are precisely recorded | Property change, script edit |
| partial | Only partial information recorded | Compound change |
| after-only | Only the after value exists | New instance creation |
| intent-only | Only the intent is recorded | Deletion, etc. |
Playtest
Prepare and observe test values, then review structured Playtest results and existing Raw Luau records saved by the AI.
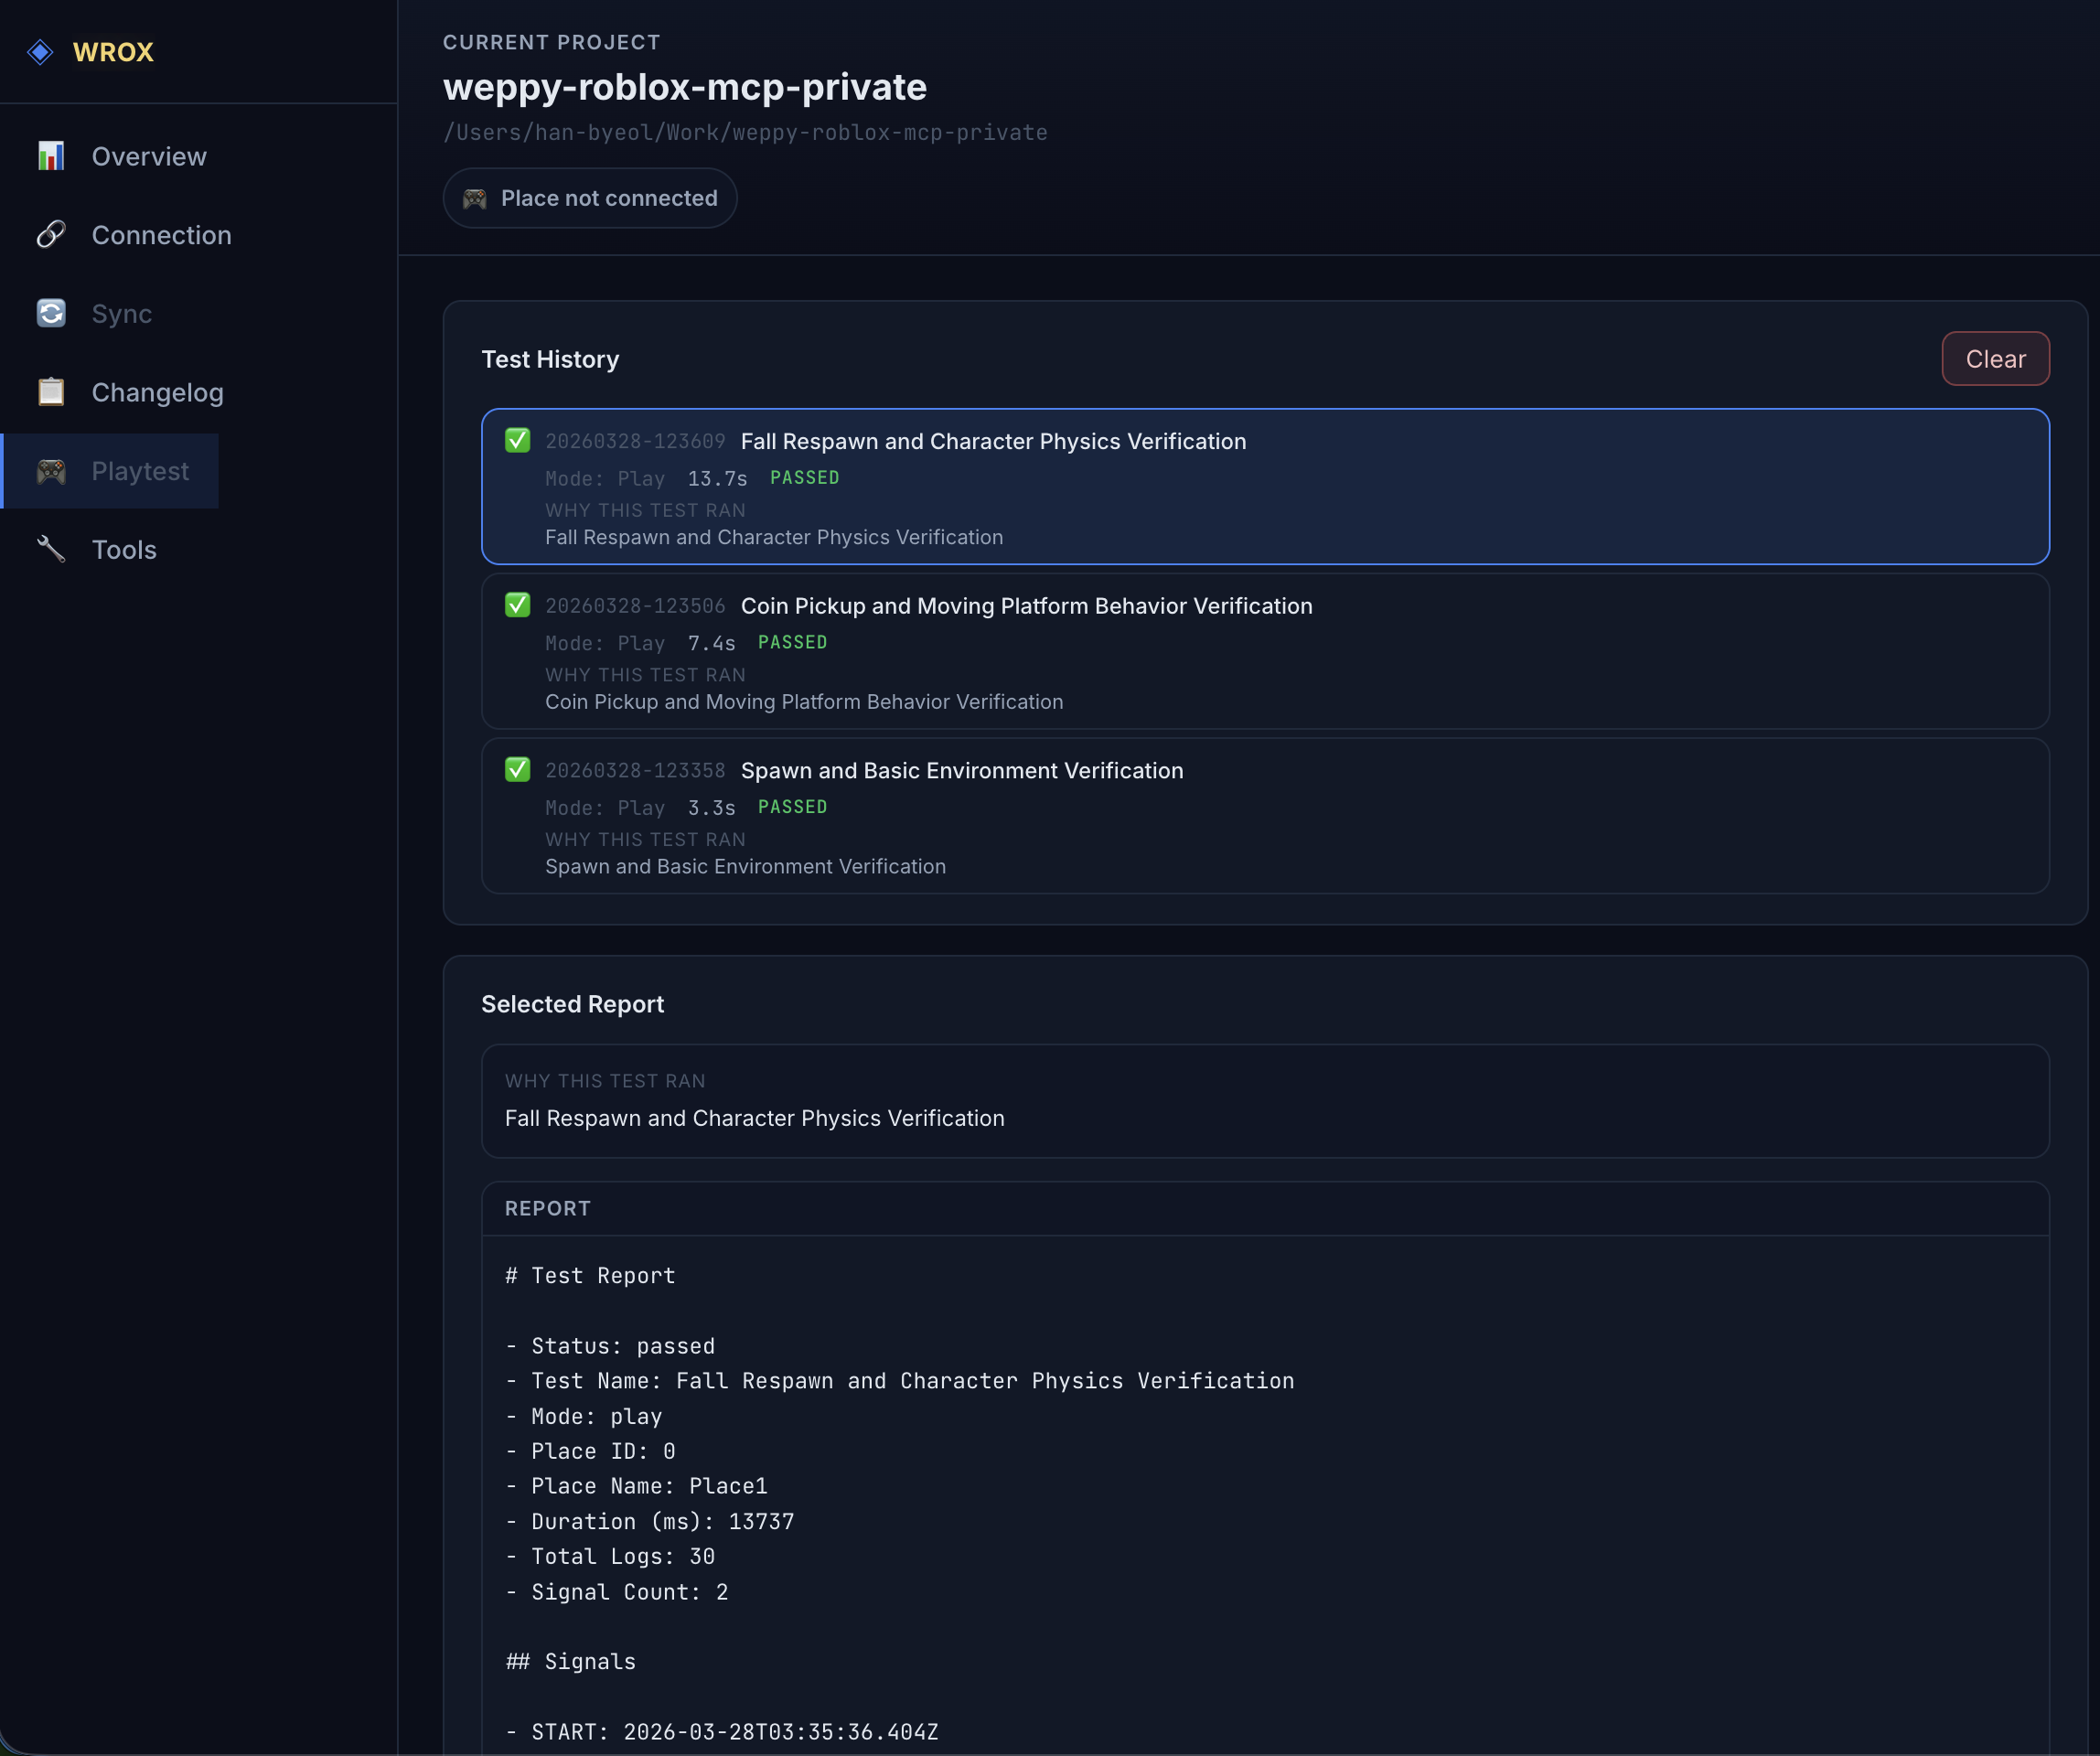
The Playtest page has separate Test Values and Automated Test Results workspaces. Use Test Values to register Studio values by profile and observe or change them during Play/Run. Automated Test Results is a viewer for stored Structured and Raw Luau runs, overall status, Play/Run mode, duration, and server/client evidence summaries.
Select a structured report to review Server, Client UI, Interaction, and Visual dimensions, required evidence, each step’s expected/observed/evidence/error values, Agent capabilities, and saved artifacts. The AI Agent and Test Coordinator control active sessions and determine their outcomes.
See Playtest for the test-value setup and apply workflow.
Tools
View the execution history and statistics for MCP tools run by the AI.
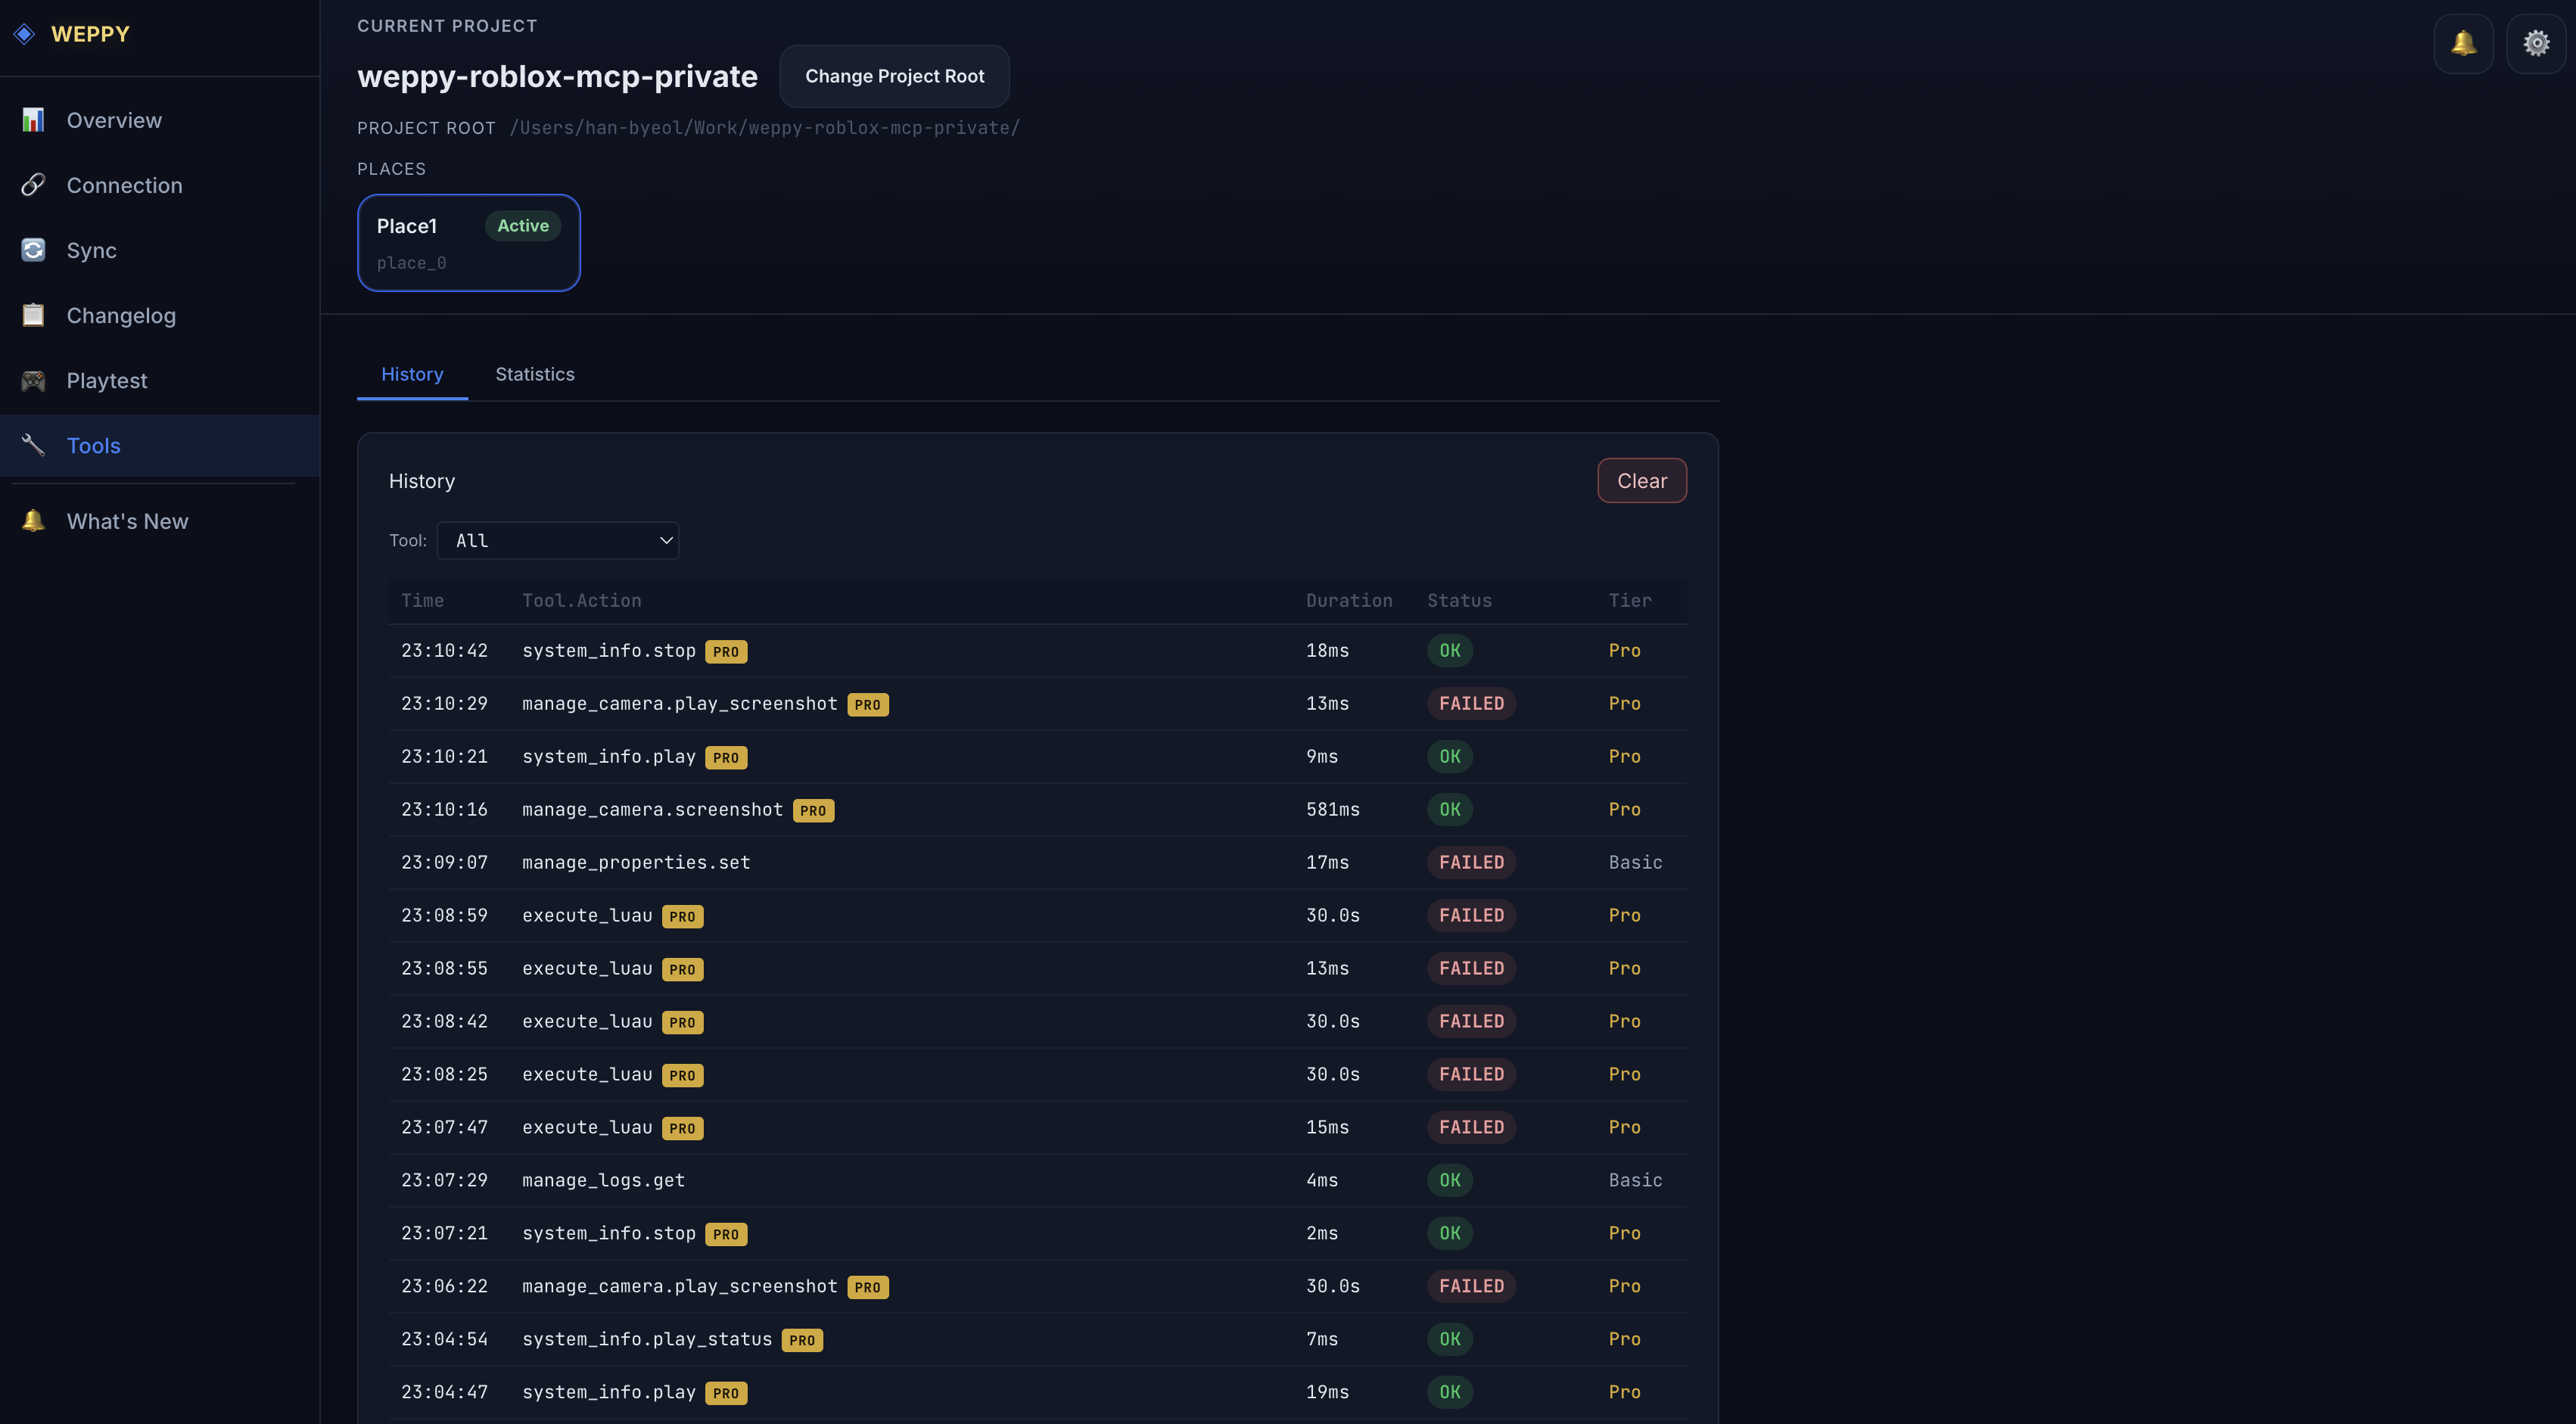
The Tools page shows the execution history and statistics for MCP tools the AI has run. It consists of two sub-tabs: History and Statistics. It is always accessible when the dashboard is in server connected or Studio connected state.
History Tab
Shows tool execution history in a chronological table:
| Column | Description |
|---|---|
| Time | Execution time |
| Tool.Action | Tool and action executed (e.g., query_instances.get_instance) |
| Duration | Time taken to execute |
| Status | Result status (OK/Error) |
| Tier | Tier used (Basic/Pro) |
Features: Filter by specific tool using the Tool dropdown, browse large histories with pagination, new execution records are added in real time.
Statistics Tab
Visually analyzes tool usage statistics:
- Tier distribution — Basic/Pro tool usage ratio
- Per-tool statistics — call count and average response time per tool
- Per-action analysis — detailed per-action statistics within a tool
Basic tier users also see a Tier Usage Progress bar and a Basic vs Pro comparison modal.
Settings
View and manage license information, server settings, and language.
The Settings page lets you view and modify license information and server settings. It is always accessible when the dashboard is in server connected or Studio connected state.
License (Read-Only)
| Field | Description |
|---|---|
| Status | Status badge (Active/Inactive) |
| Tier | Current tier (Basic/Pro) |
| License Key | Masked license key |
| Provider | License provider info |
General
| Setting | Description |
|---|---|
| Log Level | Log output level |
| History Recording | Whether to save tool execution history |
| Stats Collection | Whether to collect tool usage statistics |
| Request Timeout | Request timeout (seconds) |
Server Environment (Read-Only)
| Environment Variable | Description | Default |
|---|---|---|
HTTP_PORT | HTTP port | 3002 |
HTTP_HOST | HTTP host | 127.0.0.1 |
DASHBOARD_AUTO_OPEN | Auto-open dashboard | true |
Language
Change the dashboard UI language. Supports 6 languages + Auto (auto-detect from browser).
| Option | Language |
|---|---|
| Auto | Auto-detect from browser |
| English | English |
| 한국어 | Korean |
| 日本語 | Japanese |
| Español | Spanish |
| Português | Portuguese |
| Bahasa Indonesia | Indonesian |